The goal of WP3 is to set up a diffuse pollution identification tool to help study the simultaneous dynamics of pollutant build-up and connectivity in urban areas as a function of rainfall magnitude, timing, and climate prediction. The tool CleanCityCover is a web-based interactive application developed by the TUB team using the Shiny package in R.
A prototype of CleanCityCover was parameterised for three sub-areas of Aarhus, Denmark. Area 1 is commercial and located in the heart of the city (near Aarhus Docklands, 8000 Aarhus). Areas 2 and 3 are residential, the former modern housing in the western part of Aarhus (Tulip-grunden, Høiriisgårdsvej, 8220 Brabrand), the latter (Januarvej 1-41, 8210 Aarhus) older housing along the central ring road (O2).
An example of the CleanCityCover tool for the city centre of Aarhus is presented in Figure 1. It consists of an input panel on the left and five tabs on the top, with the tab ‘Base map’ displayed by default. The input panel contains three fields – ‘year’, ‘sub-area’ and ‘pollution type’ to be selected by the user. The user can choose between a wet, dry, and flashy year and select one of the three sub-areas. For pollution type, the user can choose either dry deposition, pollution due to traffic and metal roofs, or a combination of all three. The tab’ Base map’ to the right of the panel comprises an overview map of the city with the three areas highlighted. Once the options are selected in the Input panel, clicking the ‘Simulate’ button will display the results. Within the tab ‘Pollution results’, the user can find the spatial pattern of the selected pollution type with more detailed information about the annual load. The tab ‘Runoff’ shows the results of the functional connectivity analysis. The tab’ Pollutant Ranking’ displays a table with the pollutants ranked based on concentration and toxicity.
Future versions of the tool will include additional pollution types and study sites from different cities. A user manual has been prepared alongside the prototype, which will be updated throughout the development process.
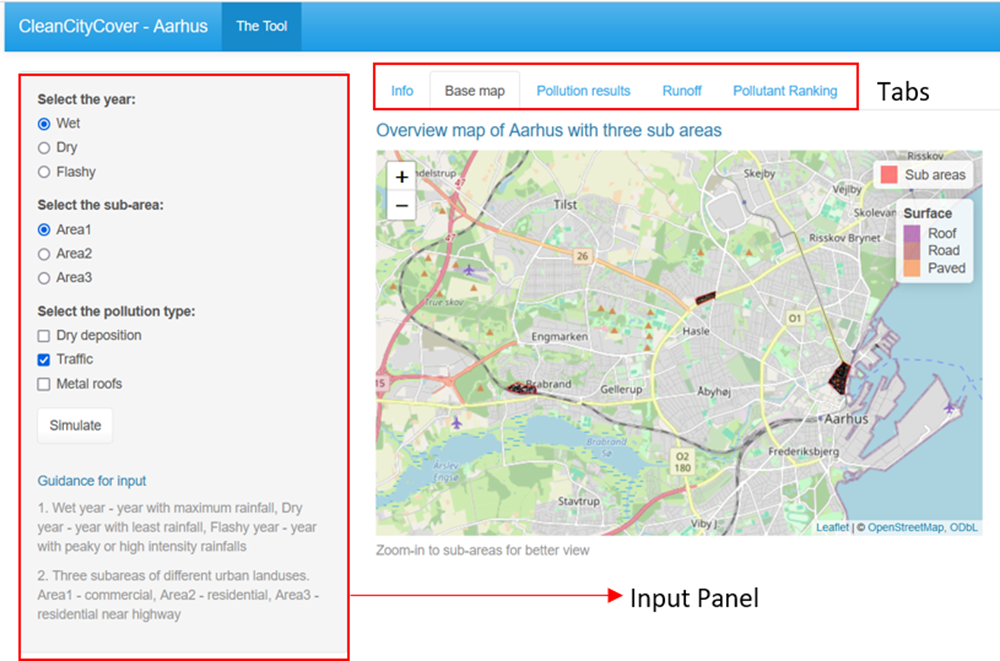
Figure 1: CleanCityCover interface upon launch, featuring the default tab ‘Base map’ with the subareas. The Input panel is seen on the left with the three fields to be selected by the user and the ‘Simulate’ button on the bottom. The additional tabs are visible on the top.
Authors: Boney Anna Joseph, TUB; Nasrin Haacke, BAM and TUB