Current work of Dublin City University (DCU) on the development of portable sensors for the detection of polycyclic aromatic hydrocarbons (PAHs) in urban water runoff also involves the design of suitable sampling campaigns for reliable collection of samples to assess the effectiveness and limitations of these new sensors when tested with real samples. Analysis of water runoff samples from densely populated areas in the city, areas of heavy traffic, or industrial parks will also allow identification of pollution hot spots, which in turn will help to understand how pollutants spread in the urban environment and to assess the impact of green infrastructures developed by WATERUN in mitigating such spread.
Anthropogenic activities such as the burning of fossil fuels (coal, natural gas, peat, wood, gasoline, etc) and municipal waste are important sources of PAHs emissions in the urban atmosphere. These airborne PAHs ultimately end up in rainwater and accumulating in groundwaters because of urban water runoff. Therefore, to design an effective sampling campaign for PAHs, it is useful to consider how airborne PAHs could spread around the emission source depending on factors such as weather or terrain. Tools like the open-source modelling software AERMOD developed by the US Environmental Protection Agency (EPA) have been widely used to predict airborne pollution deposition from a wide variety of sources. AERMOD is for example applied to forecast the ground-level air pollution resulting from the waste-to-energy incinerator located at Poolbeg peninsula in Dublin city. The Poolbeg Plume Plotter simulator utilises local meteorological data obtained from Dublin airport weather station to map the predicted air pollution around the incinerator in real time [1]. The importance of monitoring and modelling PAHs air pollution has been also recently stressed by the Irish EPA in their 2020 Integrated Assessment report [2], where it was also highlighted how higher levels of PAHs in Irish towns where particularly linked to heating seasons.
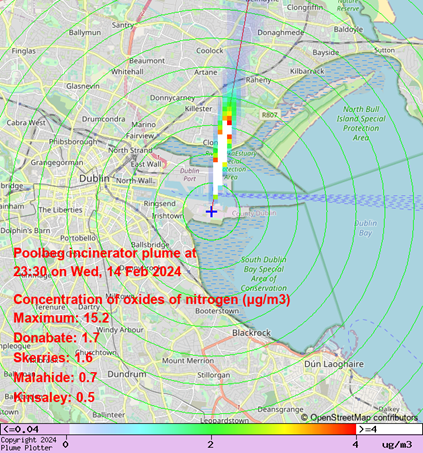
Figure 1. Snapshot of Dublin area provided by Poolbeg Plume Plotter [1].
References
[1] Poolbeg Plume Plotter. https://plumeplotter.com/poolbeg/ (last accessed on 2024-02-14).
[2] EPA, Ireland’s Environment: An Integrated Assessment 2020, https://www.epa.ie/publications/monitoring--assessment/assessment/state-of-the-environment/EPA_Irelands_Environment_2020.pdf (last accessed on 2024-02-14).
Authors: Dublin City University (DCU Team) mercedes.vazquez@dcu.ie, caoilte.orourkeocuirrin43@mail.dcu.ie)