UNIVPM is the lead of Work Package 5 (WP5 - Risk management tool & guidance for decision making) of WATERUN project, which aims at developing a new methodology for stormwater management based on a risk assessment (QMRA and QCRA). Particularly, a decision support system based on risk assessment will be created to support stakeholders decision in the management of water run-off.
During the last months of activities, UNIVPM has accomplished different actions, which aimed to engage stakeholders in a frame of co-creation methodology to get feedback to improve the QMRA calculation tool.
First, UNIVPM has submitted Deliverable 5.1, which is a document that provides a general description of the architecture of the DSS. The document has been created to stimulate and guide the discussion between partners and stakeholders to best and pragmatically address the co creation methodology envisioned in WATERUN. Indeed, the document has been shared during the last co-creation meeting organized in Santiago De Compostela (Spain).
Second, the developed QMRA calculation tool, which was developed for the assessment of the microbiological risk related to stormwater re-use for specific reuse scenarios (e.g., garden irrigation, toilet flushing) and for three different pathogens (Campylobacter, Rotavirus, Cryptospordium), was tested in an Italian Case study, where field data with relation to urban drainage modeling were already available. The scope of this additional case study developed in the early stage of WATERUN was to provide practical examples of expected outputs produced by the tool even for the best early and practical engagement of the stakeholders (that are needed in the co-creation methodology).
Lastly, the QMRA tool was improved to simplify its utilization and understanding by technicians and stakeholders. Particularly, box plots were added to the graphical user interface (GUI) to reassume results of QMRA calculation (Figure 1), and connections with GIS software were created to geographically map obtained results (Figure 2).
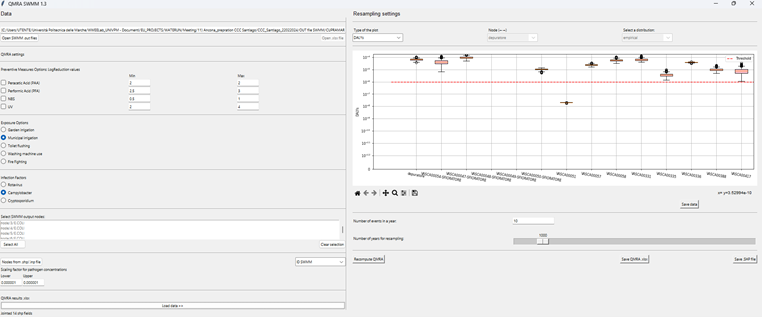
Figure 1: Graphical user interface (GUI) of the QMRA calculation tool
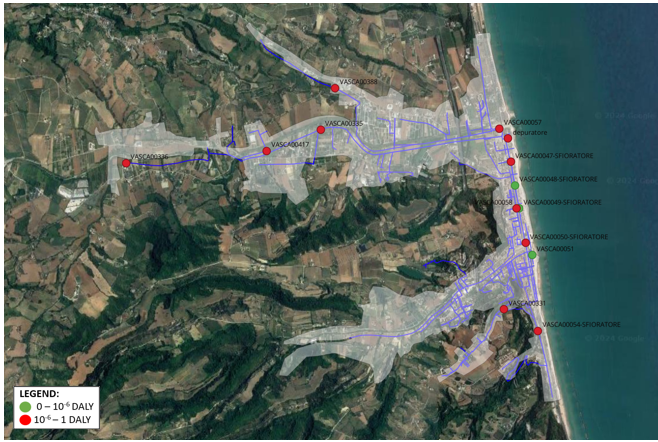
Figure 2: Mapping of QMRA results (DALY) by GIS software
Authors: Francesco Fatone, Università Politecnica Delle Marche, f.fatone[@]univpm.it ; Anna Laura Eusebi, Università Politecnica Delle Marche, a.l.eusebi[@]univpm.it ; Massimiliano Sgroi, Università Politecnica Delle Marche, m.sgroi[@]univpm.it ; Lucia De Simoni, Università Politecnica Delle Marche, l.desimoni[@]pm.univpm.it ; Debora Jareta magna, Università Politecnica delle Marche, debora.jaretamagna[@]phd.unict.it; Bartosz Zelag, Kielce University of Technology, bartoszszelag[@]op.pl; Adam Kiczko, Warsaw University of Life Sciences, adam_kiczko[@]sggw.edu.pl
5 April 2024